Feature scaling is making features take similar ranges of values. In this post, I will talk about when it is necessary and then look into two most frequently mentioned methods, min-max normalization and z-score nomalization. Finally, several other tehniques will be introduced briefly including mean normalization, robust scalar, and scaling to unit length. Examples accompany to help understand effects of each method, which are made with the Python and scikit-learn APIs.
Before diving into details, I would like to talk about the confusion due to naming discrepancies. Given the below, it seems that ‘scaling’ is ‘normalizing’, and ‘normalizing’ is ‘scaling’:
- “Feature scaling is a method used to normalize the range of independent variables or features of data.” [1]
- “The goal of normalization is to transform features to be on a similar scale.” [2]
People often use them interchangeably (e.g, Min-Max Normalization [3] and Min-Max Scaling [4])
Meanwhile, we can find many documents online that use the term, ‘normalization’, to indicate a particular scaling/normalizing method that is often called ‘min-max scaling’ or ‘min-max normalization’, typically contrasting it to other scaling/normalizing method, ‘standardization’, which is also called ‘z-score normalization’ [5][6][7].
Given the inconsistent naming, we may need some extra info to figure out what exactly it means when we run into the term, ‘normalization’, in materials dealing with feature scaling.
When should we do feature scaling?
There are two cases often mentioned as reasons for scaling: (1) to prevent feature bias when using distance-based models, and (2) to improve the performance of gradient descent [1][8][9].
- Distance-based models Models that use distances between data points like KNN, K-means, PCA, and SVM should do normalization. If there is a feature having a wide range of values, the distance will be dominated by this feature. So we make features be on a similar scale that each feature contributes approximately proportionately to the final distance. You can witness its benefit in the example made by Brownlee; it demonstarates that the KMM modeling brings different accuracy results with a not-scaled (that is, raw) and scaled data.
- Gradient descent-based optimization algorithms Scaling brings benefit to models like linear regression that use gradient descent for optimization, since gradient descent converges much faster.
Method
How can we make features take similar ranges of values? While there are many others, you may run into Z-score normalization and Min-Max normalization most often when you search for feature scaling methods. I cautiously anticipate that they are most often used in practices. Let’s first look at the brief description of each of them and then comparisons focusing on when to use which one.
Z-score normalization (often called Standardization)
This rescales the ranges of features so that they have distribution with 0 mean value and 1 standard deviation value. The formula is:
\[x' = \frac{x-\bar{x}}{\sigma}\]Min-Max normalization
This rescales values to a fixed range, usually [0, 1] or [-1, 1]. The formula for a min-max of [0, 1] is:
\[x' = \frac{x-min(x)}{max(x) - min(x))}\]The formula to rescale to a range of [a, b] is:
\[x' = a + \frac{(x-min(x))(b-a)}{max(x) - min(x))}\]Z-score normalization vs. Min-Max normalization
(1) Min-Max normalization is affected by outliers much, and Standardization is much less affected by outliers. I found a nice demonstration on this aspect in the Codecademy website [10]. Here is my replication and summary of it. First, suppose a dataset of 100 houses with two variables, the number of rooms and the total years of the house. The number of rooms ranges between 1 and 20. The years of 99 houses range between 0 and 40, and one is 100 years old – an outlier. The below compares results of scaling:
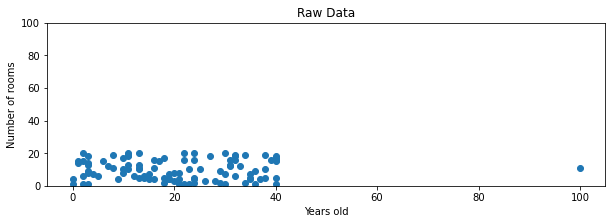
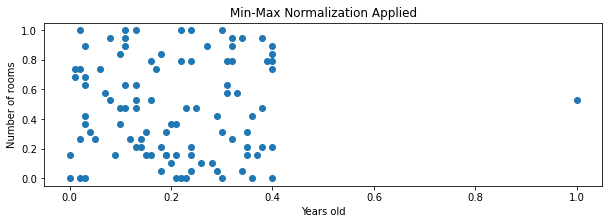
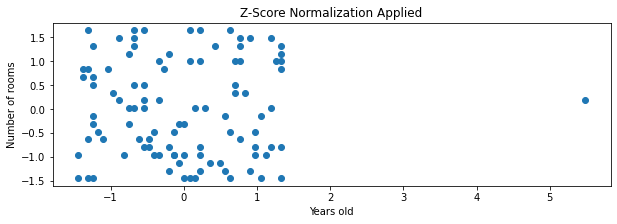
With min-max normalization, the 99 values of the age variable are located between 0 and 0.4, while all the values of the number of rooms are spread between 0 and 1. With z-score normalization, most (99 or 100) values are located between about -1.5 to 1.5 or -2 to 2, which are similiar ranges.
Note: I ran into a blog post saying that Min-Max normalization is not affected by outliers and Standardization is. I guess that the author means the bounding range of Min-Max normalization results and the unbounding range of Standardization.
(2) Often, Standardization is recommended to use when the feature distribution is Normal or Gaussian, and Min-Max normalization, when it is not [11]. Min-Max normalization just changes the range of data and Standardization changes it radically, that is, does not transform the underlying distribution structure of the data. I interprete that this is why it is OK to apply Standardization to normally distributed data (since the normal data would end up the normal data), but not recommended to apply it to non-normal data.
However, it seems there is no hard and fast rules. Here is Brownlee’s suggestion [11]:
Predictive modeling problems can be complex, and it may not be clear how to best scale input data. If in doubt, normalize the input sequence. If you have the resources, explore modeling with the raw data, standardized data, and normalized data and see if there is a beneficial difference in the performance of the resulting model.
Let’s look at a few other scaling methods.
Mean normalization
This rescales the values to a range of [-1, 1] with 0 average value. That is, it results in a distribution centered at 0, with its minimum and maximum values within the range of -1 to 1.
\[x' = \frac{x-\bar{x}}{max(x) - min(x)}\]Robust Scalar (Scaling to median and quantiles)
This uses the median and quantiles. It is less affected by outliers than the Min-Max.
\[x' = \frac{x-x_{median}}{IQR}\]Scaling to unit length
It rescales the components of a feature vector so that the length of the scaled vector is 1. One of two norm types is used; that is, divide each compoment by either the Manhattan distance (l1 norm) or the Euclidean distance (l2 norm) of the vector.
Wrapping up
I hope that I perform deeper survey and enough experiments to figure out kind of my own guidance, if any, for choosing a suitable scaling method like Hale is doing[12], although it seems not achievable to definite rules[13]. However, knowing on the underlying math behind models\scaling methods will be definitly helpful in saving time and understanding results.
References
- https://en.wikipedia.org/wiki/Feature_scaling
- https://developers.google.com/machine-learning/data-prep/transform/normalization
- https://www.geeksforgeeks.org/ml-feature-scaling-part-2/
- https://medium.com/@isalindgren313/transformations-scaling-and-normalization-420b2be12300
- https://www.statology.org/standardization-vs-normalization/
- https://www.geeksforgeeks.org/normalization-vs-standardization/
- https://towardsdatascience.com/normalization-vs-standardization-quantitative-analysis-a91e8a79cebf
- https://www.analyticsvidhya.com/blog/2020/04/feature-scaling-machine-learning-normalization-standardization/
- https://medium.com/greyatom/why-how-and-when-to-scale-your-features-4b30ab09db5e
- https://www.codecademy.com/article/normalization
- https://machinelearningmastery.com/standardscaler-and-minmaxscaler-transforms-in-python/
- https://towardsdatascience.com/scale-standardize-or-normalize-with-scikit-learn-6ccc7d176a02
- https://www.kdnuggets.com/2019/04/normalization-vs-standardization-quantitative-analysis.html/2